Product Categories
What is Powder Flow Analysis?
"Learn About Powder Flow" is a white paper published by Brookfield that describes powder flow behaviour and the resulting problems when powder flow is impeded.
Problems with Powder Relating to Gravity Flow Behaviour
A typical industrial powder processing line will include several storage vessels (e.g. bins, bunkers, silos, hoppers, Intermediate Bulk Containers or IBCs, sacks etc), feeding or handling steps (e.g. belt conveyor, screw conveyor, pneumatic conveyor, gravity chutes etc) and processing steps (e.g. milling, mixing, drying, bagging etc). Getting the powder to discharge consistently and accurately from storage in to the next process step has become a major industrial issue. Having the knowledge of the flow patterns and flow obstructions that may present inside the storage vessels on a processing line to understand the application of powder flow measurements is therefore becoming useful.
What are the Powder Flow Patterns that can Occur in a Process Storage Vessel?
In. principle, there are two types of flow patterns that may present:
Core-flow (shown in Figure 1a) can be considered the default flow pattern and is characterized by powder discharge through a preferential flow channel above the draw down point of the outlet. Powder is drawn into the flow channel from the top free surface of the inventory. This gives a first-in last-out discharge regime and, if operated on a continuous (rather than batch) mode, the powder around the walls in the lower section will remain static in the vessel until the time that it is drained down to empty.
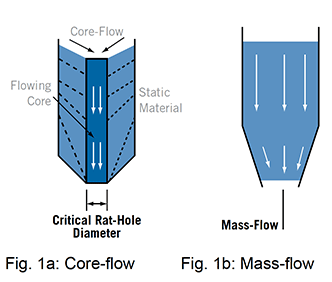
Mass-flow (shown in Figure 1b) is the desirable flow pattern for powders that are poor flowing or time sensitive, but must be specifically designed for. Here the entire contents of the vessel are ‘live’, giving a first-in first-out discharge regime. To achieve this, the hopper walls must be sufficiently steep and smooth. For a given wall material/converging angle, the powder wall friction must be below a critical value. Also, the product discharge must be controlled by a valve or feeder that allows powder to flow through the entire cross sectional area of the outlet. (It is this final point that prevents many vessels from operating in mass-flow.)
A wall friction test will be able to give an approximate assessment of whether a given hopper geometry will support mass-flow (with the proviso that the outlet area is fully active). For an exact calculation of the maximum mass-flow hopper half angle, both wall friction and flow function tests must be undertaken.
What are the Powder Obstructions that Can Occur to Prevent Flow:
In principle, there are two types of flow obstructions that may present:
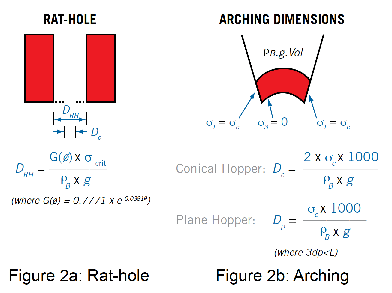
‘Rat-holing’ (shown in Figure 2a) is the principle flow obstruction in a core-flow vessel where the powder in the flow-channel above the outlet discharges and leaves a stable internal structure.
Arching (shown in Figure 2b) is the flow obstruction in a mass-flow vessel, where a stable powder arch forms across the outlet or converging walls of the hopper, thereby preventing flow.
For a given powder there is a critical outlet dimension that must be exceeded to ensure reliable discharge of a core-flow or mass-flow vessel. These are the critical rat-hole diameter Drh and the critical arching diameter DC or Dp (depending on the hopper geometry – see Figure 3). The AMETEK Brookfield Powder Flow Tester (PFT) can calculate these critical dimensions following a flow function measurement. An accurate dimension requires a wall friction test as well. Note that for a given powder the rat-hole diameter is significantly larger than the arching diameter.
Key Differences Between Powders and Fluids
Resistance to shear (viscosity) is dependent on the shear rate while it is independent of the usual pressure for Newtonian fluids. But when we see that shear stress is majorly dependent on the normal stress while being independent of the shear rate, we are referring to powders. Hence, tests are carried out at a singular speed but over a range of normal stresses when characterizing powders. Another key difference is that the stresses are unequal in all directions and are frictional, thus at wall boundaries they can generate shear stresses, this is due to powders being anisotropic. (see wall friction section).
Flow Function Test
The main way to calculate the flowability of a powder is via the powder flow function – This gives a reading of the amount of strength the material holds at a stress free surface following consolidation to stress level provided. Shown in Figure 4 is the easiest way of providing explanation for the flow function – Which outlines the uniaxial unconfined failure test. This test calculates the strength of a free standing column of powder. This condition is analogous to the condition of the powder arch across a hopper outlet shown in Figure 2b.
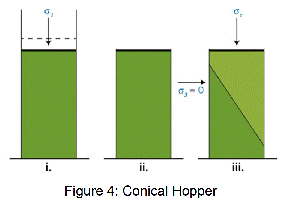
1) Consolidation of sample.
Powder is placed in a cylindrical cell and compacted under a normal stress s1.
2) Unconfined sample.
The mould is now carefully removed to reveal a compacted column of powder.
3) Unconfined failure of sample.
The normal stress acting on the column of powder is gradually increased until failure occurs, and the peak normal stress sc is recorded.
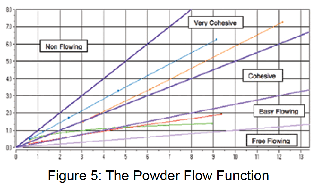
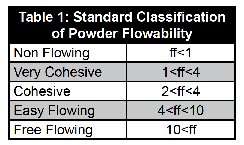
The uniaxial unconfined failure test is conducted over a range of consolidation stresses and the flow function is con-structed by plotting the unconfined failure strength versus the consolidation stress as shown in Figure 5. The greater the flow factor (ff) value, the more free-flowing the powder (Table 1).
Anticipated Uses of the Brookfield Powder Flow Tester
Bench marking – In order to determine the differences in flowability whether there is correspondence with the plant experience, flow properties on all raw powders and blends are calculated.
New materials – In order to determine whether the alternative material is possibly going to be easier or more difficult to work with, the new infredients/blends need to be tested against the already present ingredients/blends. Factored into the purchasing decision may be this possible material handling cost.
Reverse engineering – The use of the PFT in order to determine the flow properties of the individual powders may be carried out and used as a future flowability reference for future batches if plant experience with powders on a given process line is already acquired.
Design - To gain reliable flow, the designing the geometry of new hoppers/silos must be completed.
Alternative Methods of Displaying the Flow Function Test Results
To demonstrate powder flowability, the flow function can be presented graphically (as in Figure 5) to describe behaviour over the stress range of approximately 0.3kPa to 13kPa. This stress range is representative of that experienced by the powder in small to intermediate sized silos. However, describing flowability with a function may complicate the analysis as it is sometimes found that the flow functions of two different materials cross over one another, so that their relative ranking changes with stress levels. Alternatively, flowability rankings for specific stress levels can be determined by calculating the following parameters:
Estimated Critical Arching diameter [m]: The minimum silo outlet size for reliable gravity discharge in mass-flow, calculated using the arching equation in Figure 2b. The stress value is the intercept of the flow function with an ff =1.4 line. This is the default flow factor settings but can be adjusted by the user within a 1.0 to 1.8 range for silo design applications.
Estimated Critical ‘Rat-hole’ diameter in [m]: The minimum outlet diameter to prevent the formation of a stable ‘rat-hole’ in a core-flow vessel. The outlet diameter is calculated using the rat-holing equation in Fig 2a. The stress value is the intercept of the flow function with an ff=2.5 line and can be user-set to any stress level.
Flow index: The gradient of a line from the origin to the last point on the flow function, typically in the range of 0.1 to 1.0. This index will give a comparison of materials behaviour at intermediate compaction stresses greater than one meter depth of powder.
Flow intercept: The intercept of the best fit linear failure function with the unconfined failure strength axis giving a number in kPa. This gives a number that reflects powder flowability at compaction stresses typically less than 0.15m depth of powder.
Investigation into whether the material gains strength during long term storage is a test that the user may conduct via a time consolidated flow function test.
Wall Friction Test
Stress distribution within processing vessels, silos and hoppers is highly influenced by the friction that is acting at the wall/powder interface.
Rather than the bulk solid being compacted below, the powder weight is moved down through the silo/vessel/container walls more when the wall friction is higher. Powder self-weight is transferred through the bulk solid when the friction is lower. This ‘Janssen effect’ is illustrated in Figure 6, which demonstrates how the vertical pressures in the vertical section of a silo would vary if the wall friction were increased from zero to a large value of 400. In general, the stresses approach constant values at a depth of about 4 vessel diameters due to a negative feedback effect on the pressure increase with depth as a result of wall friction being present.
Software can be used to estimate pressures in a container based on measurements of the bulk density ρ, wall friction , internal friction δj and container diameter D. The principal consolidation pressure σ1 at depth Z is given by the equation:
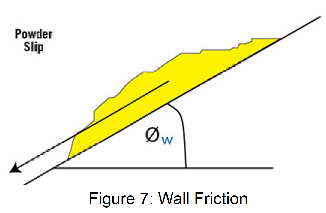
The wall friction angle represents the angle to which a wall surface must be inclined as shown in Figure 7 to cause powder to slip. The wall friction angle is typically in the range of 10 to 45 degrees. The Chute angle is the technical term for the wall friction angle.
While the results of the wall friction test can be displayed graphically in the form of a wall failure locus as shown in Figure 8a (representing the limiting shear stress the powder can support at a wall), or the form of a wall friction angle function as shown in Figure 8b (representing how the wall friction angle changes with reducing stress), one of the following four flow indices derived from the maximum wall friction locus are usually adequate. These wall failure properties are:
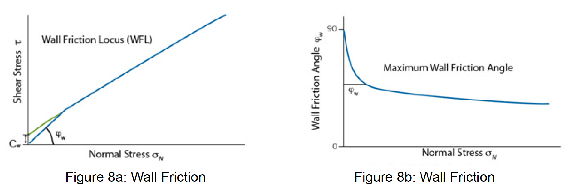
θcθp = The maximum mass-flow hopper half angle (measured to the vertical) for conical or planar hoppers.
= The maximum wall friction angle to determine the minimum chute angle for gravity flow (see Figure 8b).
Grad = The maximum wall friction angle displayed as a coefficient.
cw = The wall cohesion shear stress in kPa that can be supported at the wall under zero normal stress (see Figure 8a). This determines the ‘stickiness’, i.e. whether powder is likely to stick to the wall surface under close to zero stress. i.e. will powder build up on the walls of the chutes around discharge/transfer points.
In order to establish the possibility of long term powder build up on the wall and whether that is to be expected can be tested by subjecting the wall sample to large shear displacements (on the order of 30 meters) via an extended wall friction test.
Bulk Density Test
The stresses acting on the powder when flowing or when static in processing lines/silos is controlled by the self-weight of the powder and its bulk density. The bulk density may be measured in a separate single test for bulk density on its own, but primarily, measurements are taken via the carrying out of a flow function test (Where critical outlet dimensions are required to be taken) as well as the wall friction test.
The bulk density curve is the most common way of presenting bulk density, as seen in figure 9. Only a small increase in density with stress may be shown as in general, free-flowing materials are found to be incompressible. A large increase in bulk density paired with increasing stress will be seen as a result of a highly cohesive, poorly flowing bulk solid being present.
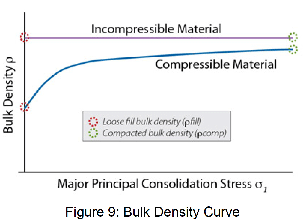
ρfill = The fill bulk density to be expected when the powder is poured into a container
ρcomp = The compacted bulk density will give an indication of the bulk density to expect if the material is poured and compacted to high stress
Summary
Four standard tests are provided by the Brookfield Powder Flow Tester:
Flow Function Test - Measures internal strength, flow function, internal friction function and bulk density function- used for characterizing the flow strength and arching/ rat-holing potential of powders.
Time Consolidated Flow Function Test - Same as above but following static storage for a user defined time period.
Wall Friction Test - Measures friction between the powder and a given wall surface and the bulk density function - used for assessing mass-flow hopper half angles and gravity flow chute angles.
Bulk Density Test - Measures bulk density curve of the powder.
Note that to undertake a full silo design requires the user to run and combine the results of tests 1, 2 and 3.